We Analyzed 50 Restaurant Google Profiles in Oslo — Here's What We Found
- SearchNova Agency
- Feb 23
- 9 min read

Updated: Mar 9
When someone in Oslo is hungry, they pick up their phone and search. Within seconds, Google shows them a handful of restaurants — and those restaurants get the customers. Everyone else gets scrolled past.
But what actually makes a restaurant show up? And once it does, what makes someone click on it instead of the one below?
We wanted to find out. So we analyzed 50 restaurant Google Business Profiles across five Oslo neighborhoods: Grünerløkka, Gamle Oslo, Frogner, Sagene, and Nordre Aker.
This time, we went deeper. We didn't just look at basic metrics like ratings and reviews. We analyzed image quality and ownership, menu implementation, SEO optimization, engagement patterns, and activity levels.
The results tell a more nuanced story — Oslo restaurants are doing better than we initially thought, but there's still a clear gap between good and great.
The Headline Numbers
Before we get into the findings, here are the numbers that stood out most:
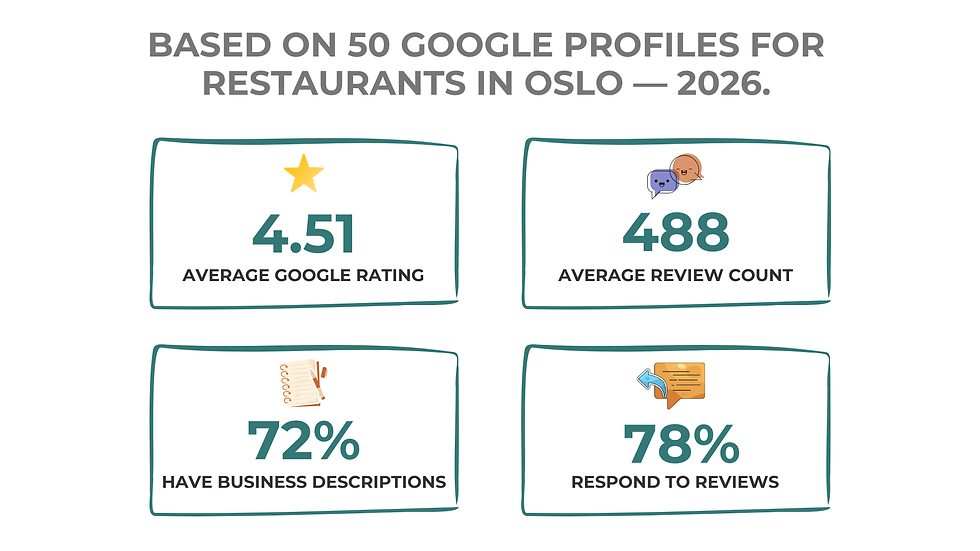
Average rating: 4.51 stars (strong and consistent)
Average review count: 488 reviews
72% have business descriptions — but only ~40% are properly optimized for SEO
78% respond to customer reviews (but quality of response varies significantly)
6% publish Google Posts (3 restaurants, still vastly underutilized)
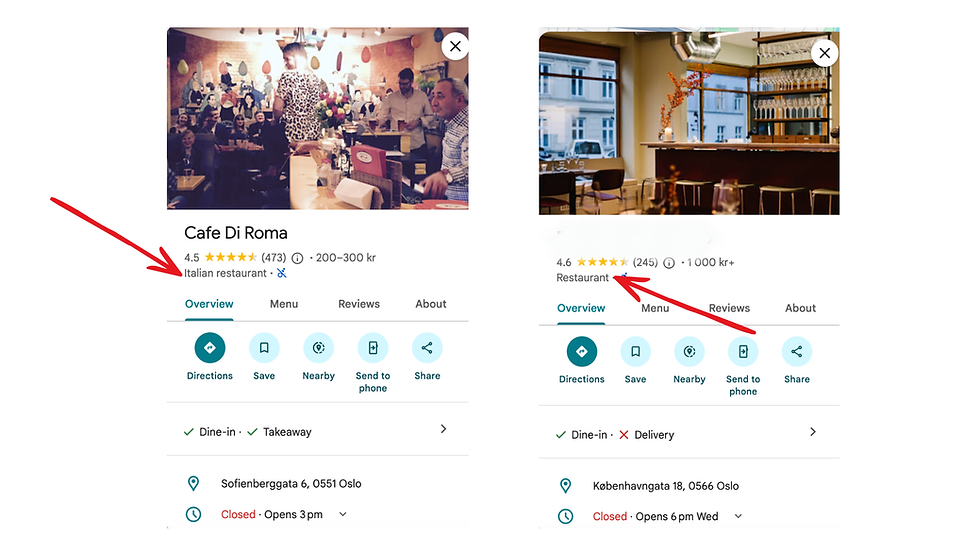
50% use generic "Restaurant" category instead of specific cuisine
42% have weak owner image presence (34% strong, 24% moderate)
52% have high-quality images (26 restaurants), 44% medium, only 4% low quality
How We Did This
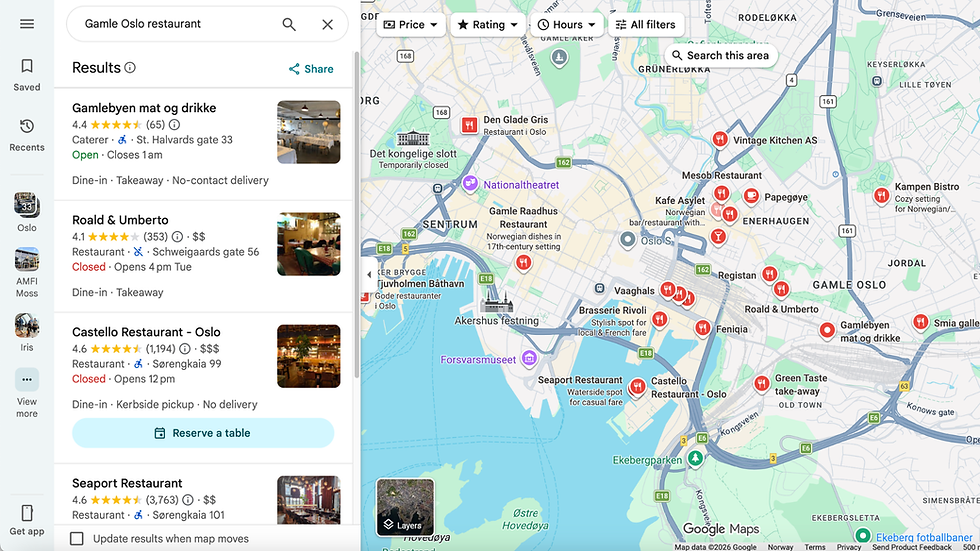
We searched "restaurants" on Google Maps in five Oslo neighborhoods and analyzed the first 10 results Google showed us in each area.
For each restaurant, we recorded 24 data points:
Visibility metrics: Rating, review count, last activity date
Image analysis: Total photos, image quality (High/Medium/Low), owner presence, recency
Content & SEO: Business description presence, category specificity, SEO optimization level
Menu management: Native Google menus, external links, menu image uploads, implementation quality
Engagement: Review response rate and engagement level (Active/Reactive/Partial), Google Posts activity, overall activity level
Opportunity assessment: Opportunity level (High/Moderate/Low) with specific notes on strengths and weaknesses
This gave us a much richer picture than basic metrics alone.
Neighborhoods covered:
Grünerløkka (10 restaurants)
Gamle Oslo (10 restaurants)
Frogner (11 restaurants)
Sagene (12 restaurants)
Nordre Aker (7 restaurants)
Finding 1: Most Restaurants Have Descriptions — But They're Not Optimized for SEO
Here's the good news: 72% of restaurants have a business description on their Google profile. That's significantly better than expected.
Here's the opportunity: Most of those descriptions are weak for SEO. They lack the key elements Google uses to rank you:
Missing elements in weak descriptions:
Location signals: The neighborhood, district, or landmarks your restaurant is in
Cuisine keywords: Clear phrases like "Italian restaurant," "Thai food," "syrisk mat"
Intent phrases: Words people actually search for, like "lunsj," "middag," "terrasse," "takeaway," "family-friendly"
Menu specifics: References to signature dishes or cooking styles that set you apart
Examples of strong SEO descriptions (from our audit):
Helt Vilt: Includes cuisine keywords (wild game, Norwegian dishes), location signals (Mathallen Oslo, Akerselva), and specific menu items
Villa Paradiso: Strong for SEO with clear keywords (napolitansk pizza, italienske retter), strong location signals (Grünerløkka, Olaf Ryes plass), and intent phrases
Castello Restaurant: Clear keywords, multiple location signals (Oslo S, Operaen), multiple intent phrases (brunsj, middag, terrasse)
The gap: Many restaurants have generic descriptions that read like filler — "Welcome to our restaurant, we serve good food" — without the location and cuisine keywords that help Google understand what they offer.
What this means for you: If you already have a description, audit it for SEO elements. If you don't, add one. A 150-200 word description with location + cuisine + intent keywords is a quick win that most competitors still aren't doing properly.

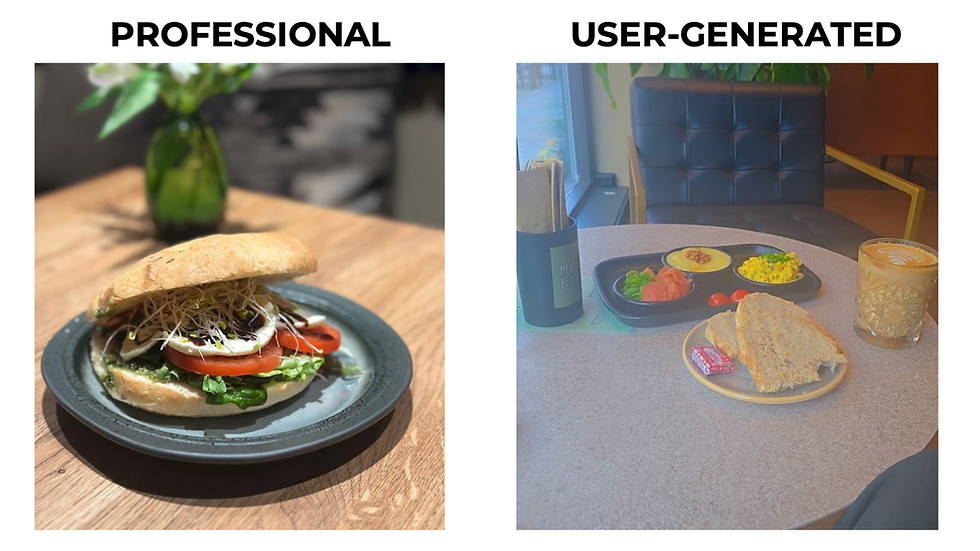
Finding 2: Image Quality Is Stronger Than Expected
Here's the surprise: 52% of restaurants have high-quality images on their profiles. Only 4% have low-quality photos. But the story gets more complicated when you look at ownership.
The breakdown:
34% have strong owner image presence (actively curate and upload owner photos)
24% have moderate owner presence (some owner photos, but mostly user-generated)
42% have weak owner presence (almost entirely user-generated content)
What we found:
Most restaurants rely heavily on user-generated content. But the good news: user photos in Oslo tend to be relatively decent quality. Poor lighting or camera issues aren't as common as expected.
Stand-out examples (doing it right with owner curation):
Helt Vilt: Strong curated image strategy with excellent ambiance and menu visibility
Bønder i Byen: Well-curated owner images showing good quality
Baba's Grill: Owner actively uploads; most images owner-selected, high quality
Vine&olives: Consistently uploads high-quality owner images
Problem cases (weak owner presence, all user-generated):
La Villa Restaurant: Owner last uploaded 9 years ago
Bamboo Sagene: Most images are 2+ years old
Tiffany's Sagene: Owner stopped uploading 5+ years ago
Villa Paradiso: Owner seemed to curate images many years back but stopped
The gap: Restaurants with fresh, well-lit, professionally-framed owner photos rank higher in local search and convert more clicks than those relying entirely on customer shots. But with 52% already at high-quality level, the opportunity is in consistency and freshness, not basic quality.
What this means for you: You likely don't have a photo quality problem. The opportunity is in owner curation — uploading 2-3 fresh owner photos per month shows Google and customers that you're actively managing your profile. This differentiates you from the 42% that have abandoned their photos.
Finding 3: Menu Implementation Is Half-Optimized
Most restaurants are doing something with menus, but very few have a complete, redundant setup.
The breakdown:
62% have Google Native Menus (built-in ordering/viewing system)
54% have external menu links (to external ordering platforms like Wolt, Foodora)
92% upload menu images to their profile
BUT only 36% have ALL THREE (complete menu implementation)
What this means:
92% are uploading images (good start)
62% have native menus (solid)
54% have external links (solid)
But 74% are missing at least one component
The pattern: Most restaurants are doing something, but they're not building redundancy. A restaurant might have a native menu but no external link. Or upload images but no native menu. This means customers might not find all menu options depending on how they search.
What "full implementation" looks like:
Menu images on Google (for browsing)
Native Google menu (for viewing in Google)
External link (to Wolt, website, or other platform for ordering)
Only 36% have all three. The other 64% are leaving customer pathways incomplete.
What this means for you: If you're in the 64% with incomplete menus, audit which component(s) you're missing and fill the gap. If you only have images, add a native menu. If you have native but no external link, add that. The redundancy matters because customers approach menus from different angles.
Finding 4: Review Response Is Actually Strong — But Quality Varies
This is one of the biggest surprises: 78% of restaurants respond to reviews.
But it's more complicated than that:
The breakdown:
38% respond actively (consistent engagement across both positive and negative reviews)
30% respond reactively (mostly to negative reviews, or inconsistently)
10% respond occasionally (a few responses, then go silent for months)
22% never respond (zero engagement despite having reviews)
The restaurants doing it right (Active):
Castello Restaurant: Consistent responses across review types
Folkvang Sagene: Regular engagement
Vineria Ventidue: Replies thoughtfully to both positive and negative
Pascal Greek & Grill: Frequent responder
The problem cases (Reactive):
Some restaurants respond only when negative reviews appear, using a defensive tone
Others respond infrequently, missing the relationship-building opportunity
A few engage but sometimes confrontationally (like Anatolia, which responds to push back)
Why this matters: Google confirmed that responding to reviews is a ranking factor. Beyond SEO, responding shows future customers that you care. A restaurant with 1,000 reviews and active responses signals excellence.
What this means for you: 78% responding is good. But if you're in the "reactive" group, shift to being more proactive — respond to positive reviews to thank customers, and handle negatives with solutions rather than explanations. This takes 15 minutes per week.

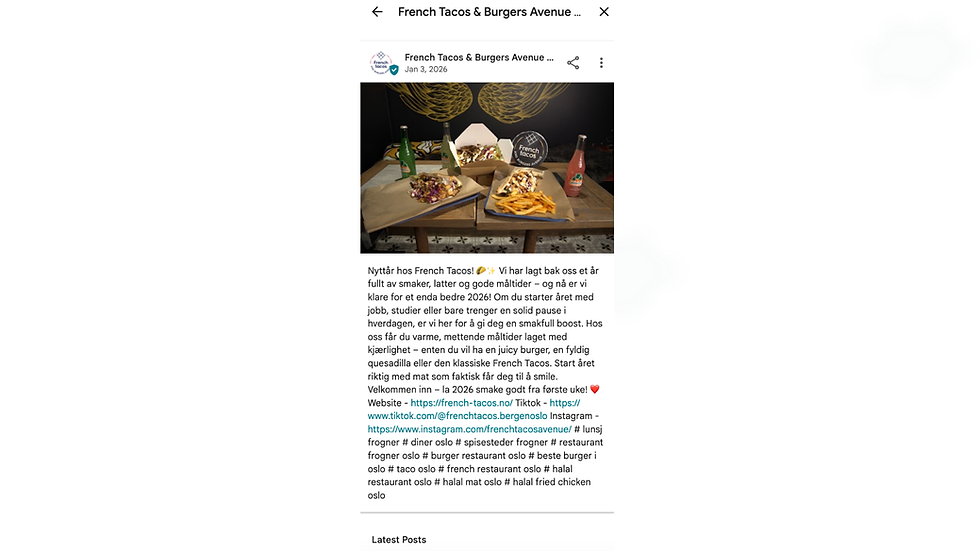
Finding 5: Google Posts Are Still Underused (But Growing)
Out of 50 restaurants, 3 publish Google Posts. That's 6%, up from the single restaurant we initially reported.
Google Posts are free updates that appear directly on your business profile. You can share specials, new menu items, seasonal dishes, weekend events, or promotions.
The restaurants doing it:
Castello Restaurant (and 2 others)
Why 94% aren't posting:
Awareness: Most don't know the feature exists
Effort: It feels like another thing to manage
Unclear value: Hard to measure direct ROI
The opportunity: In a market where 94% of restaurants don't post, even basic weekly activity makes you stand out immediately. This is legitimately one of the easiest ways to differentiate.
What you could post:
New dish or seasonal menu item
Weekend special or happy hour
Event or catering opportunity
Limited-time promotion
Staff spotlight or behind-the-scenes content
What this means for you: If you start posting weekly Google updates, you'll immediately differentiate your profile from 94% of competitors in Oslo. This takes 5 minutes per week. It's the lowest-hanging fruit.
Finding 6: Generic "Restaurant" Category Still Affects 50% of Profiles
Half of restaurants (50%) use the generic "Restaurant" category instead of a specific cuisine.
When someone searches "Italian restaurant Oslo" or "Thai food near me," Google prioritizes restaurants with those specific categories. The 50% using "Restaurant" are invisible for these searches.
Restaurants with specific categories (doing it right):
Helt Vilt (Norwegian)
Trattoria Popolare (Italian)
Mesob Restaurant (Eritrean)
Registan (Uzbekistan)
La Villa Restaurant (Turkish)
Apsorn Thai Restaurant (Thai)
Restaurants misclassified (losing opportunities):
Trattoria Crudo (listed as "Restaurant" — should be "Italian" or "Pizza")
Keyser Social Frogner (listed as "Restaurant" — should be "Asian")
What this means for you: Check your category. If you serve Italian food, make sure Google knows it. This is a 2-minute fix in your Google Business Profile settings that directly impacts which searches you show up in. You're competing at a disadvantage if you use "Restaurant."
Finding 7: Neighborhood Breakdown — Who's Doing What
Grünerløkka: High volume, mixed management
Highest average review count (Villa Paradiso: 2,800, Trattoria Popolare: 1,800)
Good traffic, but profile management varies widely
Some well-managed (Helt Vilt, Bønder i Byen), others neglected
Opportunity: Moderate — the winners are already pulling away; catching up requires consistent effort
Gamle Oslo: Traffic leaders with inconsistent strategy
Highest average reviews overall (Vaaghals: 1,500, Castello: 1,200)
Heavy hitters with strong customer bases
Profile management is inconsistent — only Castello is notably active
Opportunity: High — lots of customer base to leverage with better profile management
Frogner: Best managed overall
Highest percentage of active review responders (6 out of 11)
Highest average rating (4.51 stars)
More restaurants actively curate images
More diverse in category usage
Opportunity: Lower — already doing many things right, diminishing returns
Sagene: Most inconsistent
Mix of well-managed profiles (Nazar café-bar, Folkvang) and neglected ones
Some profiles appear unclaimed (Sushi House Sagene)
Wide variation in image quality, engagement, and curation
Opportunity: High — big gap between best and worst means room to move up quickly
Nordre Aker: Mixed quality with bright spots
Best rated overall: Baba's Grill (4.9 stars) with excellent owner management
Some active responders (Pascal Greek & Grill)
Others showing minimal effort
Opportunity: Moderate — inconsistency creates opportunity
Finding 7: High Ratings Don't Require Perfect Profiles
The highest-rated restaurants don't necessarily have the most complete or optimized profiles.
Case studies:
Baba's Grill (4.9 stars, Nordre Aker)
✓ Excellent owner photo management
✓ Fresh, high-quality images
✓ Consistent activity
✗ No description
✗ No Google Posts
✗ Doesn't respond to reviews
Verdict: Food quality drives ratings; profile management is secondary
Vine&olives (4.9 stars, Frogner)
✓ Strong owner image curation
✓ Actively responds to reviews
✓ Good menu implementation
✗ Limited description optimization
✗ No Google Posts
Verdict: Better profile management, but still leaving search visibility on the table
Villa Paradiso (4.2 stars, Frogner)
✓ High review volume (1,472 reviews)
✓ Good review engagement (responds regularly)
✗ Old, mostly user-generated images
✗ Limited description optimization
✗ Misclassified category
✗ No Google Posts
Verdict: Traffic from reputation, but profile is outdated and poorly optimized
The pattern: Ratings come from food and service quality. Profile optimization is driven by marketing effort. The best performers combine both — strong food + managed profiles = top visibility.
The Verdict
Oslo restaurants are doing better than we initially thought. Most have reviews, most have photos, most have descriptions, most respond to feedback.
But there's a clear tier system:
Top tier (the 20-25% winning): They audit their categories, optimize descriptions for SEO, maintain fresh owner photos, respond consistently to reviews, and stay active.
Middle tier (the 50% doing okay): They have the basics — reviews, photos, description — but don't optimize or maintain strategically.
Lower tier (the 25-30% lagging): Neglected profiles with old photos, weak responses, generic categories, no posts.
The gap isn't about doing more. It's about doing these specific things strategically and consistently. The restaurants that do this already are pulling ahead. The opportunity for everyone else is clear.
Comments